
COVID-19 – deaths & excess deaths
Executive Summary
* This week's note looks at deaths during spring 2020 for Australia, the US, and the UK. It presents the most recent data for deaths with COVID-19, a few weeks on from the peak in deaths that occurred for all three countries in April 2020.
* Excess mortality – the number of people dying above normal – is a key measure to consider with a novel virus. This note presents calculations and estimations of excess deaths during this period, noting that approximately 20-30% of excess deaths are reported as not related to COVID-19. The reasons for these deaths are not understood as yet.
* Death rates are presented in the context of normal death rates, typical average daily death rates and within the context of other periods of excess mortality.
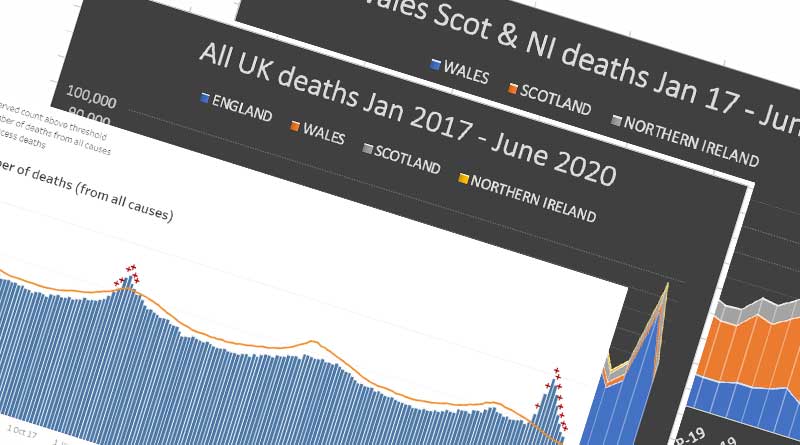
* Australia has had so few deaths with COVID-19 that the virus won't be discernible among normal death rates. The US and UK graphs show a spike for spring 2020, but this is not dramatically different to previous periods of excess deaths from other viruses.
* Within the US and the UK, different regions have fared very differently. The reasons for this, just as the reasons that different countries have fared so differently, are not yet understood.
* There is much that we still don’t know – not least deaths that may occur in months to come from conditions that have been neglected during the past few months.
Introduction
I first wrote about COVID-19 on the 20th March (Ref 1). I didn’t know then that the UK would be put into lockdown on 23rd March and I didn’t expect that Wales would still be in pretty much full lockdown almost 100 days later. Now is a good time to take a first reflective look at the data, as the peaks have long since passed in the US, UK and Australia – which is where most readers of this note reside. The peak in Australia occurred in the first week of April. The UK peak was around April 8th. The US is a bit more complicated, because different states had peaks at different times, but one of the main virus data sites, worldometer, suggests that the US as a whole peaked around April 21st (Ref 2).
All of the following numbers are correct as of the time of writing this note (June 24th – June 29th). Please note that I’ve used worldometer data for COVID-19 death numbers to optimize consistency between the countries being reviewed. Worldometer records deaths by date reported. The date of death occurring can differ from the date of death reported for many reasons – weekends and holidays being one of the main ones. A death might happen on a Saturday and not get reported until Monday. This has the effect of making the bars on deaths charts look ‘a bit all over the place’. The curve drawn across the bars – to average out these artificial jumps – is the important line to look at.