The Belgian Dietary Guidelines

A new food pyramid has just been published by an organisation called The Flemish Institute for Healthy Life. The pyramid is now official dietary advice for Flanders, which is the Dutch speaking part of Belgium. (There is no sign that the guidelines for the rest of Belgium have changed).
In this week’s note I take a look at the history of Flemish dietary guidelines and what is different about this new pyramid. I’ll review the new advice – is it evidence-based? Is it good advice? How and why has it come about? The whole article is an easy read – no stats! Enjoy it below.
A brief history of Flemish dietary guidelines
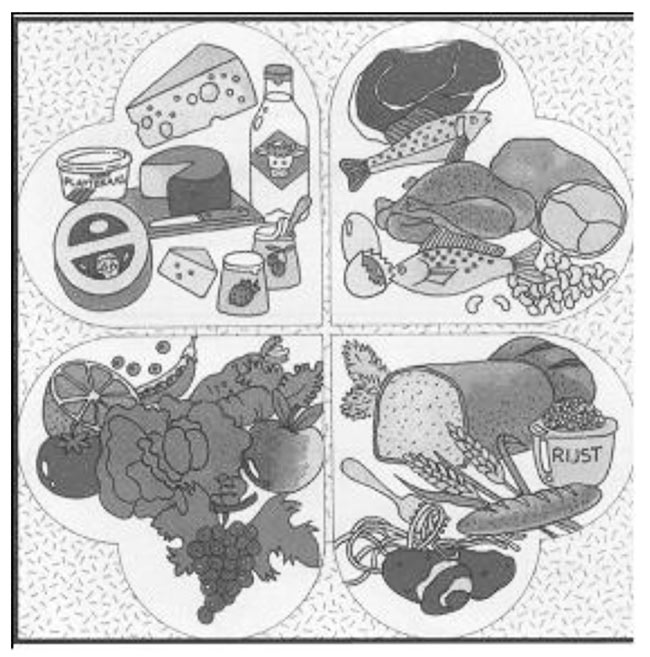
Flanders started off with a pretty good dietary guidelines diagram back in 1967. It was known as the four leaf clover and it had four sections – equal in size: i) Dairy – milk, cheese, yogurt; ii) Meat, fish, eggs, nuts; iii) Vegetables and fruit; and iv) Starchy foods – bread, pasta, rice, potatoes.
Then the pyramid diagrams became more common in the global dietary guideline world and Flanders developed their own in 1997. The cereals equivalent of 5-12 slices of brown bread and 3-5 cooked pieces of potato were recommended daily! In 2000, some tweaks were made to the pyramid and in 2004 an activity layer was added to the bottom to make the diagram “The Active Food Pyramid.”
The 2017 pyramid
The 2017 pyramid has been turned upside down because, as the creators said, a pyramid is read from top to bottom and so the most important foods should be at the top. This pyramid is intended for the general public from the age of one year! (That’s the lowest age I’ve ever seen adult guidelines apply).
The top (biggest) layer of the pyramid features carbs basically: fruit; vegetables; potatoes; pasta; rice and bread. There are also pictures of tofu, nuts and vegetable oil. The middle section has fish, eggs, yoghurt, milk, cheese and chicken. The bottom (tiny part of the triangle) has just two products – butter and red meat – with the guideline “LESS”. There’s also a circle off to the side of the pyramid featuring stuff to avoid – some of the foods in the circle should be avoided, one we would die without!
What we need to consume
To assess whether or not the pyramid is evidence-based, I go back to what human beings need to consume (beyond water) to survive, let alone thrive. The essential nutrients are: complete proteins; essential fats; vitamins; and minerals. A simple table of protein quality, vitamins and minerals shows which foods are the most nutritious and it’s not the ones at the top of the new Flanders pyramid.
Why is the pyramid not evidence based?
I then ask why has yet another national dietary guideline been published, which is not evidence-based? I offer two reasons:
1) Because we have decided that fat is bad and animal foods are bad. Holding this belief leads to the inevitable consequence that we think that carbohydrate and plant foods must be good. There is no evidence that they are – it’s simply the outcome of believing that some things are bad.
2) Because we think that it is better for the planet to feed the population on plants, rather than on animals. If animals are fed on plants – and so we produce crops to feed cattle to then eat the cattle – I would agree. This is an insane food policy. However, the planet needs ruminants grazing on the land to sustain top soil. In the vegan ideal of a world of plant food, with no animals being eaten (and therefore no cows, sheep, chickens, goats, pigs etc, as farmers don’t keep pets) there is nothing to rejuvenate top soil and it will disappear (as it already has in many parts of the world and it has become a fraction of the depth it once was on many other parts of the world.) Without top soil, we lose the ability for food to come from the earth. Then what?! I suggest the endgame in the full article!
The Full Article
On October 9th 2017, Professor Tim Noakes tweeted about a new food pyramid in Belgium asking “Wonder what anyone hopes this will achieve? On basis of what evidence? Will outcomes be measured?”
The pyramid was published on September 19th by an organisation called the Flemish Institute for Healthy Life. What is this organisation? Is this new official Belgian policy? What does the pyramid advise? Is the advice good? Let’s take a look…
The Flemish Institute for Healthy Life
The Flemish Institute for Healthy Life describes itself as “a government-recognized center of expertise.” The organisation dates back to September 1991 when it was The Flemish Institute for Health Promotion (VIG). There have been a number of changes in name and focus. In 2009, the organisation became the Flemish Institute for Health Promotion and Disease Prevention (VIGeZ). In 2017, VIGeZ changed its name again to become The Flemish Institute for Healthy Life.
I contacted the organisation to ask 1) Is the Is the Flemish Institute for Healthy Life a government organisation? and 2) Is this pyramid now official Belgian policy?
I received a very prompt and helpful reply: 1) “We are a non-profit organization and official partner of the Flemish government for nutrition and health promotion (funding comes mainly from the Flemish government)”; and 2) “This is indeed the official food guide for Flanders (Dutch speaking part of Belgium).”
This is not new health policy for the whole of Belgium therefore – just for Flanders, which is one of three regions in Belgium. The Food and Agricultural Organization of the United Nations (FAO) reports the Belgian and Flemish guidelines on this site. The Flemish pyramid needs to be updated by the FAO in the light of these new guidelines. I am not aware that any changes have been made to the food pyramid for the French community.
A brief history of Flemish dietary guidelines
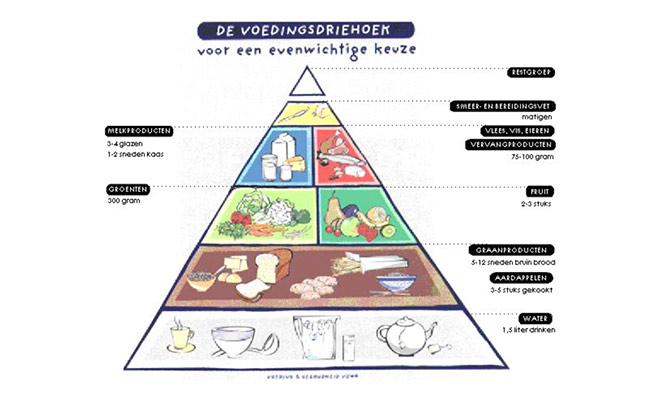
In Flanders, the first diagram for dietary advice was developed in 1967. It was known as the four leaf clover and it had four sections – equal in size: i) Dairy – milk, cheese, yogurt; ii) Meat, fish, eggs, nuts; iii) Vegetables and fruit; and iv) Starchy foods – bread, pasta, rice, potatoes. This was commendable, real food, advice.
The four leaf clover was replaced in 1997 with a classic food pyramid, with starchy (fattening) foods as the base of the food pyramid, then fruit and vegetables, then dairy, meat, fish and eggs squashed up in the narrow part of the diagram. The portions were quite staggering: the cereals equivalent of 5-12 slices of brown bread and 3-5 cooked pieces of potato were recommended daily:
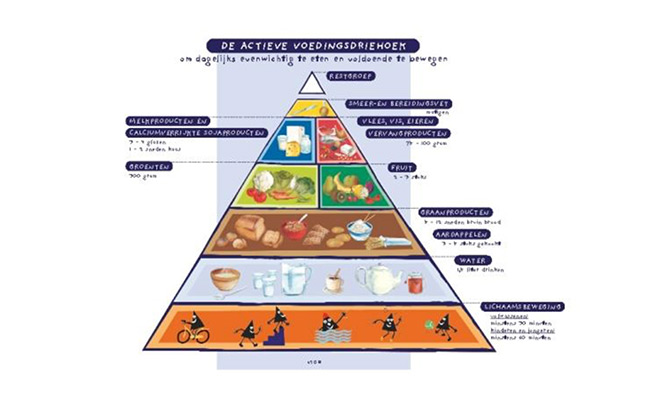
In the year 2000, so-called “calcium-enriched soy products” were added to the food pyramid. In 2004, a layer of activity was added at the bottom to make the diagram “The Active Food Pyramid.” These two amends are reflected in the following diagram:
The 2017 pyramid
The context for the latest diagram was given as “The general public is constantly bombarded with information about health. Think about the internet and (social) media where there’s advice from self-declared experts and experienced professionals, and irresponsible statements made by the media based on unreliable studies.” In this context, The Flemish Institute for Healthy Life wanted to create a model, which communicated clear and accessible messages to the general public, as well as to health professionals. Given the context, one would also hope that this new pyramid would be evidence-based and backed up by reliable studies…
The pyramid is intended for the general public from the age of one year! (That’s the lowest age I’ve ever seen adult guidelines apply). The pyramid shape was recognised by 73% of Flemish people, in a 2013 survey, so the creators of the new model wanted to retain the shape. The pyramid was inverted because (as explained by its creators) a pyramid is read from top to bottom and so the most important foods should be at the top.
A panel, with representatives from health sciences, universities and other health organisations, put together the new pyramid. There were no declared conflicts of interest and none seemed obvious from the names of the people and organisations. Hence, unlike the English ‘eatwell’ plate (adopted by the rest of the UK), which was assembled by the who’s who of the fake food industry, this pyramid appears to be conflict free.
The evidence relied upon for the Flanders pyramid was listed as:
– International recommendations. The three countries listed as influences, were the Netherlands, America (Dietary Guidelines for Americans) and France.
– Supplementary scientific literature in relation to food, food groups and healthy eating. The document presenting the scientific literature is here. It’s in Dutch, which is double Dutch to me ha ha, but the references at the back are in English and I see quite a few references to Mozaffarian – funded by, and lover of, polyunsaturated fats. I certainly don’t see any authors who have published evidence contrary to conventional dietary guidelines. I also don’t see any evidence for the plant-based pyramid e.g. “A Meta-Analysis of Randomised Controlled Trials where beans and tofu replaced meat and dairy.”
– Supplementary scientific literature in relation to sustainable eating. The document presenting the scientific literature is here. Most of the references are in English and the belief system underpinning the reference choice is clear: “A global assessment of the water footprint of farm animal products” and “Replacement of meat and dairy by more sustainable protein sources”, as examples. Other references are about “plant-based diets”, “animal welfare” and “meat avoidance”. I saw none about how plant food can sustain top soil, without which the planet can no longer produce real food .
– Advice from “The Superior Health Council” – described as an independent body for scientific advice.
The pyramid that was drawn up by the panel is pictured below:
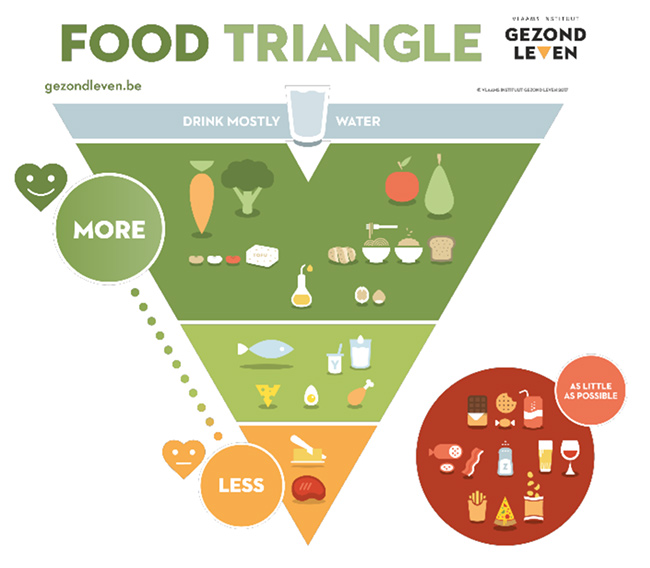
To spell out the visuals in the diagram:
– The top section advises the population of Flanders to eat MORE: carrots; broccoli; apples; pears; beans; tofu; oil (presumably vegetable oil); potatoes; pasta; rice; bread; and nuts.
– The next section (moving away from MORE toward LESS) includes: fish; yoghurt; milk; cheese; eggs; and chicken.
– The bottom section (LESS) has just two products – butter and red meat.
Off to the side of the triangle is the circle advising “AS LITTLE AS POSSIBLE” of: cake; biscuits; sweets; fizzy drinks; salami; bacon; salt; beer; wine; chips/fries; pizza and crisps/potato chips. I agree that some products in this red circle are best avoided, but others should be embraced. Salt is an essential nutrient. Curing (salami and bacon) has been a natural way of preserving meat for at least as far back as the Ancient Greek era (800-500 B.C.) and the PREDIMED study listed “at least seven glasses of wine a week” as adherence to the recommended “Mediterranean Diet”.
The green to amber part of the pyramid fares little better in terms of evidence. If we go back to the basics of what human beings need to consume (beyond water) to survive, let alone thrive, the essential nutrients are: i) complete proteins; ii) essential fats (omega-3 and omega-6); iii) 13 vitamins (the fat soluble vitamins – A, D, E and K – and the 8 water soluble B vitamins and the water soluble vitamin C); and iv) a number of minerals. There is no requirement for carbohydrate to be consumed.
i) Carefully selected combinations of plant foods can provide complete protein, but the simplest and most reliable provider of complete protein is animal foods (meat, fish, eggs, dairy). ii) The essential fats are provided by any food that contains fat: meat; fish; eggs; dairy; nuts; seeds; olives; avocados; oils etc. For iii) vitamins and iv) a selection of essential minerals, I’ve selected some samples from the United States Department of Agriculture (USDA) all foods database.
In the Table below, we have broccoli, apple, rice (brown – to be as favourable as possible) and olive oil. I’ve compared vitamins (there are no data for B7/biotin) and minerals for 100 grams of each of these foods with: chicken liver (there is no offal on the diagram); sirloin steak (in the LESS section); and sardines – below the starchy, carb foods section. (All foods are reported in the raw/uncooked state).
I’ve highlighted the ‘winner’ in each row, so that you can see at a glance which product is most nutrient dense. Olive oil wins on calories – probably not the one you want to win. Liver then cleans up on 7 of the 12 vitamins documented by the USDA database. Liver beats apples for vitamin C, but broccoli rightly wins vitamin C overall. Brown rice marginally beats liver for B1, but at three times the calorie intake. Olive oil is the best provider of vitamin E in the Table below, but, again, at nearly 900 calories for 14mg of this nutrient, you’d be far better off getting the daily 15mg vitamin E requirement from 50g of sunflower seeds at fewer than 300 calories. Brown rice wins for manganese and magnesium. Far better to consume cocoa powder, which would win for 7 out of 10 of the minerals listed.
| (All per 100g) |
Liver |
Sirloin steak |
Sardines |
Broccoli |
Apple |
Brown rice |
Olive oil |
| Calories per 100g |
116 |
154 |
208 |
34 |
52 |
370 |
884 |
| Protein Quality |
149 |
94 |
148 |
83 |
31 |
75 |
0 |
| Vitamins | |||||||
| A (IU) |
11,077 |
0 |
108 |
623 |
54 |
0 |
0 |
| B1 (mg) |
0.3 |
0.1 |
0.1 |
0.1 |
0.0 |
0.4 |
0 |
| B2 (mg) |
1.8 |
0.1 |
0.2 |
0.1 |
0.0 |
0.1 |
0 |
| B3 (mg) |
9.7 |
7.2 |
5.2 |
0.6 |
0.1 |
5.1 |
0 |
| B5 (mg) |
6.2 |
0.6 |
0.6 |
0.6 |
0.1 |
1.5 |
0 |
| B6 (mg) |
0.9 |
0.6 |
0.2 |
0.2 |
0.0 |
0.5 |
0 |
| Folate (mcg) |
588 |
13 |
12 |
63 |
3 |
20 |
0 |
| B12 (mcg) |
16.6 |
1.2 |
8.9 |
0 |
0.0 |
0 |
0 |
| C (mg) |
17.9 |
0 |
0 |
89.2 |
4.6 |
0 |
0 |
| D (IU) |
neg |
0 |
272 |
0 |
neg |
0 |
0 |
| E (mg) |
0.7 |
0.3 |
2 |
0.8 |
0.2 |
1.2 |
14.3 |
| K (mcg) |
0 |
1.2 |
2.6 |
102 |
2.2 |
1.9 |
60.2 |
| Minerals | |||||||
| Calcium (mg) |
8 |
27 |
382 |
47 |
6 |
23 |
1 |
| Copper (mg) |
0.5 |
0.1 |
0.2 |
0.0 |
0.0 |
0.3 |
0 |
| Iron (mg) |
9.0 |
1.5 |
2.9 |
0.7 |
0.1 |
1.5 |
0.6 |
| Magnesium (mg) |
19 |
22 |
39 |
21 |
5 |
143 |
0 |
| Manganese (mg) |
0.3 |
0.0 |
0.1 |
0.2 |
0.0 |
3.7 |
0 |
| Phosphorus (mg) |
297 |
193 |
490 |
66 |
11 |
333 |
0 |
| Potassium (mg) |
230 |
323 |
397 |
316 |
107 |
223 |
1 |
| Selenium (mcg) |
54.6 |
24.1 |
52.7 |
2.5 |
0.0 |
23.4 |
0 |
| Sodium (mg) |
71 |
54 |
504 |
33 |
neg |
7 |
2 |
| Zinc (mg) |
2.7 |
3.9 |
1.3 |
0.4 |
0.0 |
2 |
0 |
Why is the pyramid not evidence based?
Why has yet another national dietary guideline been published, which does not seem to understand the fundamentals of essential nutrients – proteins, fats, vitamins and minerals – and where these nutrients are found? I think that there are two reasons:
It was interesting that the approach for the Flemish pyramid was split into two areas: 1) scientific literature in relation to food, food groups and healthy eating and 2) literature in relation to sustainable eating. These two separate factors provide what I believe to be the explanation for where we keep going wrong:
1) Regarding (1), it is a long-held belief that certain foods are bad for us. We have been repeatedly told, for decades, that fat is bad, saturated fat is worse, red meat is trying to kill us, butter and cheese will clog our arteries (how this is even possible, unless you intravenously inject food, I know not!) This propaganda has become too ingrained for the general public to simply drop such non-sense overnight. It has become even more ingrained among the health professionals who spout it and they are, therefore, even less likely to change than the average person.
If one’s belief is that fat is bad, given that protein tends to stay fairly constant at 15-20% of most natural diets, the inevitable consequential belief is that carbohydrate must be good.
If one’s belief is that animal foods are bad, the inevitable consequential belief is that plant foods must be good.
If one’s belief is that red meat and dairy are bad, the inevitable consequential belief is that beans and tofu must be good.
Tofu, fruit, bread, potatoes, rice and pasta are at the top of the Flemish pyramid not because there is any evidence that these foods are healthier than offal, meat, fish, eggs and dairy products, but because the panel started from the erroneous belief that certain foods are bad and therefore other foods must be better. This was the fundamental flaw in the original dietary guidelines, dating back to the US in 1977. We don’t tell people to eat at least 55% of their diet in the form of carbohydrate because we know carbohydrate to be healthy. We don’t even know that it is safe in this volume. It is the inevitable consequence of telling people to eat no more than 30% of their diet in the form of fat.
2) This brings in (2). A more recent, and becoming equally common, belief is that we can feed more people with plants than animals. People who believe this, believe that it takes several kilograms of grain to make one kilogram of meat. If this were true, notwithstanding that the grain is a comparatively poor provider of nutrition, it would be UNsustainable. This may be the case in the U.S. and, where it is, it should stop. It is not the case in the UK and Europe and should not be the case anywhere in the world (Ref 1). Ruminants need to graze on the land for the rejuvenation of top soil and the protection of the planet’s ability to produce food. Their water should fall freely from the sky and their food is freely available in the pastures below. Grain should not be wasted on our grazing ‘tractors’ – indeed ruminants are no more able to digest modern grains than are humans.
Amazonian rainforests are not under threat from grazing cattle. They are under threat from massive deforestation to make room for soybean production. Soybeans that are intended to feed cattle, which must cease; and soybeans that are intended to feed human beings, who follow their government dietary guidelines. The latter should also cease, for the health of our planet and population (Ref 2).
The basic facts about nutrition, and our nutrient requirements, tell us that plants compare poorly with animals. Tofu and pasta can’t end up in the prime slot on an evidence-based food pyramid. This can only happen if there is false assumption that the most nutritious foods are bad – for people and/or the planet. That is the belief system that led to the Flanders food pyramid.
This is the vegan utopia. The trouble is – the ultimate end game is a world where all available land is used for plant food. Ruminants would be redundant. Their vital role in rejuvenating top soil would also cease. The soil in the fields with plant food would diminish year on year. Every rainfall would wash more of it away, making the rivers even browner than they are now (as the process is well under way with our unnatural grain consumption). Within years, probably not even decades, the soil would be unable to grow crops. Fear not – this is also the utopia for ‘agri-business.’ Such companies can already grow ‘food’ in sheds without soil, sunlight or water. The plant food utopia culminates in the likes of Cargill and Monsanto controlling the food supply and thus ruling the world. Every plant-based food pyramid takes this plot for a James Bond movie one step closer to reality.
References
Ref 1: An interesting article on this can be seen here: (https://www.forbes.com/sites/timworstall/2012/09/03/it-does-not-take-7-kg-of-grain-to-make-1-kg-of-beef-be-very-careful-with-your-statistics/%232cc6845e5f0d).
Ref 2: This 20 minute video about the role of ruminants may be of interest.
Liver: http://nutritiondata.self.com/facts/poultry-products/666/0
Sirloin steak: http://nutritiondata.self.com/facts/beef-products/7493/2
Sardines: http://nutritiondata.self.com/facts/finfish-and-shellfish-products/4114/2
Broccoli: http://nutritiondata.self.com/facts/vegetables-and-vegetable-products/2356/2
Apple: http://nutritiondata.self.com/facts/fruits-and-fruit-juices/1809/2
Brown rice: http://nutritiondata.self.com/facts/cereal-grains-and-pasta/5706/2
Olive oil: http://nutritiondata.self.com/facts/fats-and-oils/509/2