Red meat & Type 2 Diabetes
Executive summary
* This week’s study made media headlines worldwide and generated much interest on Twitter.
* It claimed that having examined data from 216,695 people, red meat intake (total, processed and unprocessed) increased the risk of developing Type 2 Diabetes (T2D).
* This makes no sense from the outset, as diabetes is a glucose handling issue and meat contains no glucose. It would be more obvious to suspect the buns, fries and fizzy drinks that hot dogs and burger are consumed with.
* I reviewed the paper and found 14 issues. There may be more:
Issue 1 – the inaccuracy of Food Frequency Questionnaires (upon which this study was based).
Issue 2 – the reported intakes were changed (the researchers ‘calibrated’ the reported intakes, which increased risk ratios.)
Issue 3 – the definition of red meat included sandwiches and lasagna.
Issue 4 – the serving sizes have changed since the original Food Frequency Questionnaires.
Issue 5 – the intakes used to compare people have become more extreme.
Issue 6 – the study claimed that women consume more red meat than men; that would be a first.
Issue 7 – total red meat was claimed to have a higher risk than both processed red meat and unprocessed red meat. Total red meat is the sum of the other two. It can’t be worse than both.
Issue 8 – the healthy person confounder. The red meat eater had a higher BMI and was more likely to smoke and less likely to exercise. We can’t adjust for a completely different person.
Issue 9 – the reported calorie intake was absurd.
Issue 10 – the characteristics table reported all food intake except the relevant ones – sugar and grains.
Issue 11 – the headline claims did not adjust for the higher BMI.
Issue 12 – even if there were no issues 1-11, the study could only suggest association not causation.
Issue 13 – the relative risk numbers grabbed the headlines; the absolute risk differences were a fraction of one per cent.
Issue 14 – the plausible mechanisms proposed applied far more sensibly to the bun, fries and fizzy drink (which were ignored) than to the burger.
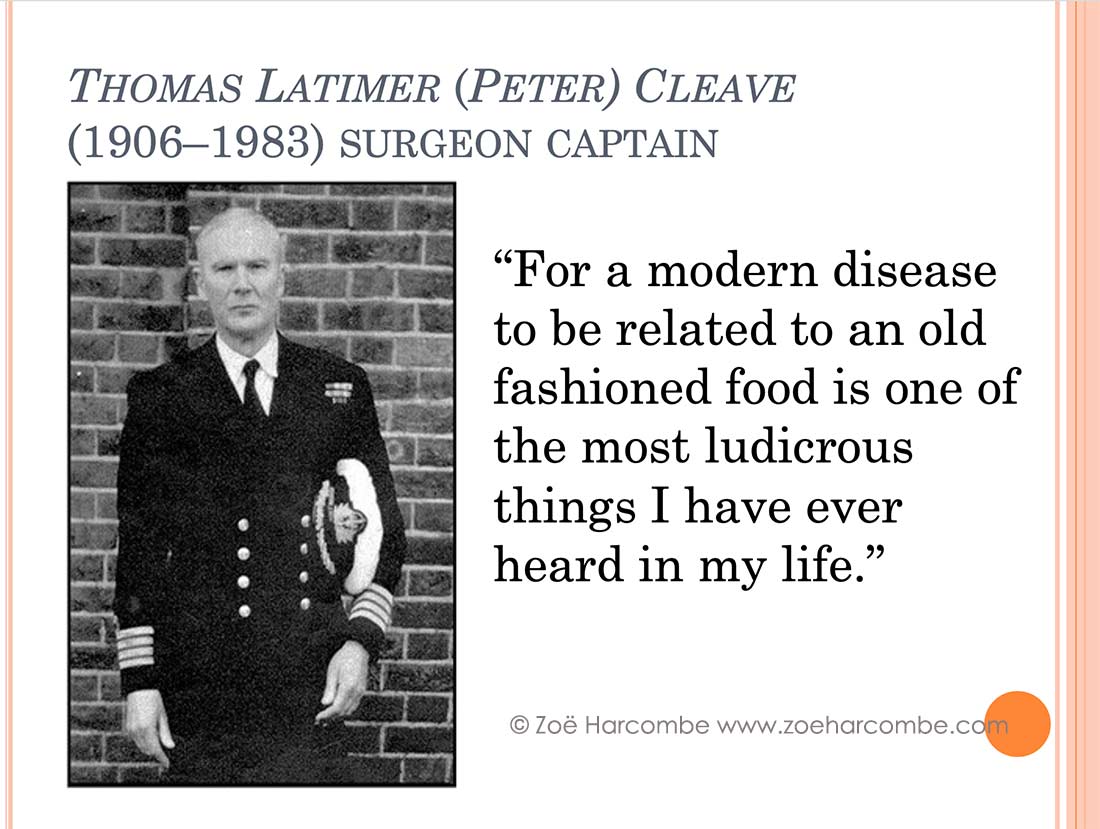
The bottom line can be summed up by surgeon captain Peter Cleave. “For a modern disease to be related to an old fashioned food is one of the most ludicrous things I have ever heard in my life.”
Introduction
I lost count of the number of emails I received asking me to look at this week’s topic. On October 19th, 2023, there were headlines across the pond claiming, “Eating red meat twice a week may increase type 2 diabetes risk, study finds” (Ref 1).
This makes no sense. Diabetes is essentially the inability to handle glucose. Meat contains no glucose. Carbohydrates contain glucose. My immediate thought was – don’t blame the burger for what the bun, fries and fizzy drink did. It’s also the latest paper from the Harvard epidemiological paper production factory. All their papers promote plants and condemn animal foods. This is just their latest attack on red meat.
The paper generating this week’s headlines was called “Red meat intake and risk of type 2 diabetes in a prospective cohort study of United States females and males” (Ref 2). The article was published in the American Journal of Clinical Nutrition. The lead author was Gu. Other authors included Frank Hu and Walter Willett. It used the standard US population studies – the Nurses’ Health Study (women) and the Health Professionals Follow Up Study (men). It used both the Nurses’ Health Study I and the Nurses’ Health Study II.
I checked back for previous posts on my site on this topic and found one from 2011 (Ref 3). It emanated from the Harvard epidemiological paper production factory. It generated media headlines “Two slices of bacon a day increases diabetes threat by 50” (Ref 4). The article was called “Red meat consumption and risk of type 2 diabetes: 3 cohorts of US adults and an updated meta-analysis” (Ref 5). The article was published in the American Journal of Clinical Nutrition. The lead author was Pan. Other authors included Frank Hu and Walter Willett. It used the standard US population studies – the Nurses’ Health Study (women) and the Health Professionals Follow Up Study (men). It used both the Nurses’ Health Study I and the Nurses’ Health Study II.
Spot the similarities; twelve years apart.
The study
Epidemiological studies, also called population studies, start with a large population of people. They gather lots of information on them at baseline and then follow them for a number of years, continuing to gather information. Researchers review the data to look for patterns. E.g. did the smokers end up with more lung cancer? These patterns, called associations, are then supposed to be tested in randomised controlled trials (RCTs). This doesn’t happen nowadays. RCTs are too expensive and take too long. Researchers just publish associations and they’re happy for people to infer that A causes B. The clear inference from this study, and the media headlines, is ‘eat red meat and get type 2 diabetes (T2D).’
Let’s go through what was done and reveal the issues along the way.
To capture the facts up front. The Gu et al 2023 study used data from 216,695 US people:
– 84,315 women in the Nurses’ Health Study I (NHS I) (started 1980);
– 42,163 men in the Health Professionals Follow Up Study (HPFS) (started 1986);
– 90,217 women in the Nurses’ Health Study II (NHS II) (started 1991).
They were followed up for a total of 5,483,981 person years. This will be useful for calculating absolute risk later on.
The issues
Issue 1 – the inaccuracy of Food Frequency Questionnaires.
At baseline, participants in the NHS I, the NHS II and the HPFS would have completed a Food Frequency Questionnaire (FFQ). The 1980 FFQ used in the NHS included 61 items. In 1984 and thereafter the FFQ included 120 items. On the FFQs participants were asked to report their average intake of each food or drink over the past 12 months. This is known to be inaccurate to start with (Ref 6).
This reference links to the original 61 item FFQ (Ref 7). You can see the meat questions on P4. Participants were asked “How often did you eat the following over the past 12 months…?” (How accurately could you answer these questions for the past year?)
The amounts were in 9 categories: 6+ per day; 4-6 per day; 2-3 per day; 1 per day; 5-6 per week; 2-4 per week; 1 per week; 1-3 per month; almost never.
The meats were:
i) Chicken without skin (6-8oz);
ii) Chicken with skin (6-8oz);
iii) Hamburgers (1);
iv) Hot dogs (1);
v) Processed meats (sausage, salami, bologna etc) (piece or slice);
vi) Bacon (2 slices);
vii) Beef, pork or lamb as a sandwich or mixed dish (stew, casserole, lasagne etc); *
viii) Beef, pork or lamb as a main dish (steak, roast, ham etc. 6-8oz).
* For (vii), note that no serving size was given and meat sandwiches and meat lasagna (carbs) were considered meat.
Issue 2 – the reported intakes were ‘calibrated.’
The authors proved that they know that FFQs are inaccurate because they changed the results. They called it calibration: “we calibrated self-reported red meat intake with weighed diet records for the first time.”
We need to introduce two other (smaller) population studies at this point – the Women’s Lifestyle Validation Study (WLVS) and the Men’s Lifestyle Validation Study (MLVS). Participants of WLVS and MLVS were recruited as subsets of NHS, NHS II, and HPFS participants and members of a Boston-area health plan. Among the WLVS and MLVS participants, there were 1,207 people who provided 7-day weighed diet records and FFQs. The weighed diet records are more accurate, albeit over a much shorter period.
Gu et al cited two papers as evidence for how to correct errors in FFQs using 7-day diet records (Ref 8). They then adjusted the intakes for all 216,695 participants based on this. The paper reported “Stronger associations between red meat intakes and T2D risk were observed after calibrating dietary exposures. Before the calibration, a 1-serving intake increment in total red meat was associated with a 28% higher risk of T2D; after the calibration, this was 47%.”
This calibration exercise thus increased claimed risks (Ref 9).
Issue 3 – the definition of red meat included sandwiches and lasagna.
The above categories of red meat (from the 1980 FFQ) continue to be the definitions of total red meat, processed red meat and unprocessed red meat. The Gu et al (2023) paper reported that total red meat intake was the sum of serving intakes of processed and unprocessed red meats. Processed red meats included beef or pork hot dogs; bacon; processed meat sandwiches; and other processed meats such as sausage. Unprocessed red meats included lean or extra lean hamburger; regular hamburger; beef, pork, or lamb as a sandwich or mixed dish; pork as a main dish; and beef or lamb as a main dish. The sandwich/lasagna (carbohydrate) confounder can thus occur in both processed and unprocessed red meat categories.
Chicken – called poultry in the paper – was not included as red meat. Poultry intake was not reviewed as a risk factor in the paper.
Issue 4 – the serving sizes have changed.
The serving sizes used were identical in the 2011 and 2023 papers. “One serving of unprocessed red meat equals 85 g of pork, beef, or lamb; one serving of processed red meat equals 28 g of bacon or 45 g of hot dog, sausage, salami, bologna, or other processed red meats.”
The first nurses recruited were asked how often they consumed 2 slices of bacon. The bacon serving size is now 1 slice of bacon (28g/1 oz). The original 1 hot dog would equate to the 45g of hot dog used today. Did participants realise that a slice of salami meant 45g? The FFQs asked about 6-8oz intake of chicken, beef, pork, lamb etc. A portion is now defined as 85g, which is 3 oz. How has this been adapted? If a 1980 nurse ate 5oz of beef every day but never ate 6-8oz of beef, did she translate her consumption into 6-8oz equivalents?
Issue 5 – the intakes used have changed.
The 2011 paper reported risk ratios for a one serving a day increase. The Pan et al study reported “The pooled HRs (95% CIs) for a one serving/d increase in unprocessed, processed, and total red meat consumption were 1.12 (1.08, 1.16), 1.32 (1.25, 1.40), and 1.14 (1.10, 1.18), respectively.” i.e. they claimed that there was a 12% higher risk in developing T2D for 1 serving a day more unprocessed red meat, a 32% higher risk of T2D for 1 extra serving a day of processed red meat and a 14% higher risk of T2D for 1 extra serving a day of all red meat.
The 2023 paper reported intakes differently. This paper put participants into five similar sized groups (called Quintiles). They compared people in the lowest intake group (Q1) with people in the highest intake group (Q5). Women in the NHS I, for example, consumed 0.46 servings a day of all red meat in Q1 and 2.62 servings a day in Q5. Men in the HPFS consumed 0.24 servings a day of all red meat in Q1 and 2.42 servings a day in Q5. We have another issue…
Issue 6 – men vs women red meat consumption.
This study claims that women consume more red meat than men in servings per day. (This held for NHS I, but not NHS II). As far as I recall, this would be the first study to assert this.
Comparing the top and bottom groups, the 2023 paper claimed, “Comparing the highest to the lowest quintiles, hazard ratios (HR) were 1.62 (95% confidence interval [CI]: 1.53, 1.71) for total red meat, 1.51 (95% CI: 1.44, 1.58) for processed red meat, and 1.40 (95% CI: 1.33, 1.47) for unprocessed red meat.” Now 62%, 51% and 40% higher risks for developing T2D are being claimed for total red meat, processed red meat and unprocessed red meat. We have another issue…
Issue 7 – processed red meat vs unprocessed red meat.
In other studies I have reviewed, (including the 2011 one) processed red meat has the highest claimed risk; unprocessed red meat has the lowest risk and total red meat is somewhere in between. This study claims that total red meat has a higher risk than both processed and unprocessed red meat. Total red meat is the sum of the other two. It can’t be worse than both (Ref 10).
I found a fundamental error in the 2011 paper (see the original post), which was acknowledged and corrected by the Harvard experts. Is there another fundamental error in this paper?
Issue 8 – the healthy person confounder.
The characteristics table is the place to start in any population paper. This is usually Table 1 in the paper. It tells us the baseline characteristics of people in the study. The characteristics table is categorised by the subject of interest – in this study, that’s red meat intake. Hence the 216,695 people in this study were split into columns by red meat intake.
Table 1 retained the original data from each population study so the 84,315 women from NHS I were separated from the 90,217 women from NHS II and the 42,163 men from HPFS. Each of these three groups was split into a further three groups – the lowest intake of red meat (Q1), the middle intake of red meat (Q3) and the top intake of red meat (Q5). The top and bottom groups were compared with each other, as we saw above.
When you look at the characteristics table, you can immediately see differences in people in the top and bottom groups. The red meat intake is never the only difference. In this table, the highest red meat consumers had higher BMIs, they were less physically active, they were more likely to be current smokers and they were less likely to take multivitamins. There is always a healthy person confounder. The burger/hot dog consumer is less healthy than the quinoa/kumquat consumer in many ways – not just red meat.
Issue 9 – the reported calorie intake.
The striking thing about this characteristics table was the energy intake. One look at Table 1 and a peer-reviewer should have rejected the paper. The average (mean) total calories were as follows:

We are being asked to believe that (take NHS I first), women in Q1 (the lowest red meat intake group) averaged just 1,202 calories a day. The 2,032 calories a day for Q5 seems far more accurate for nurses (on their feet all day) in 1980. Take the HPFS, do we really think that male health professionals were averaging 1,684 calories a day in 1986? I suggest that people in the bottom groups did not complete the questionnaire properly.
(The study excluded women with an energy intake below 500 or above 3,500 calories and men with an energy intake below 800 or above 4,200 calories. It is common to exclude extremes as being clearly unreliable. However, the bottom group – and the middle group – still had calorie intakes that were literally unbelievable.)
Calorie intake was then adjusted for, but it was so obviously wrong to start with, any adjustment would have been wrong. The paper should be ignored for this alone.
Issue 10 – what was missing from the characteristics table.
Table 1 reported intakes of a number of different foods in addition to the foods of interest – total red meat, total processed red meat and total unprocessed red meat. The other foods reported were poultry, fish, eggs, dairy, nuts and legumes, fruits and vegetables. All of these were adjusted for, although many of them were barely different in servings per day between the groups. Taking the NHS I as an example, poultry and total dairy were barely different in servings/day between Q1 and Q5. Nuts and legumes and vegetables were higher in Q5 than Q1. (Where were the headlines, higher vegetable, nut and legume intake is associated with higher risk of T2D?)
(As an aside, given that the calorie intake in Q1 was so ridiculous, it would have been interesting to see intakes as a proportion of calories.)
However, which food groups were missing from Table 1? There are nine food groups: meat; fish; eggs; dairy; vegetables; fruit; nuts and seeds; legumes and grains (Ref 11). There is also sugar, which is not a food group, but which is prevalent in processed food, and which has an unquestionable impact on T2D. The two significant omissions in Table 1 are thus grains and sugar.
The footnote to Table 2 claimed that all food groups were adjusted for – including whole grains and refined grains. So why would whole grain and refined grain intake not be reported in Table 1? Then we could see, at a glance, the grain intake of the group that was most likely to develop T2D.
Issue 11 – the headline claims did not adjust for BMI.
Once I’ve dissected the characteristics table in a population paper, I look to see where the headline claims come from. The abstract presents the headline claims. In this paper the headline claims were 1.62, 1.51 and 1.40 risk ratios (for developing T2D) for total red meat, processed red meat and unprocessed red meat respectively. These numbers could be found in Table 2. They came from Model 3.
There are usually a few models presented. Model 1 adjusts for very little. In this study, Model 1 adjusted for age and total energy intake (good luck with the latter). Model 2 adjusted for everything (BMI, race/ethnicity, smoking, alcohol, physical activity, family history of conditions etc, and other food group intakes.) Model 3 adjusted for everything that Model 2 did, except BMI. Model 3 was not adjusted for BMI. Model 3 was the one that provided the headlines.
As we saw in Issue 8, people in the highest red meat intake group had significantly higher BMI. In NHS II, for example, the average (mean) BMI in Q1 was 23.5 vs 25.6 in Q5.
The paper justified not adjusting for BMI as follows: “Because of the likelihood that weight gain mediates at least part of the association between red meat intake and risk of T2D, we did not adjust for adiposity in the primary analysis.” The researchers have thus assumed that BMI is higher at least in part because red meat intake is higher and therefore BMI should not be adjusted for. BMI could have been higher because grain and sugar intake was higher, BMI could have been higher because activity was lower, but no, let’s keep the focus on red meat.
Issue 12 – association not causation.
We’re now into the classic issues with every population study (it’s just that this study had multiple other issues before we got to these). Population studies can only suggest associations, not causation.
Notwithstanding all the issues above (1-11), even if this paper had been robust, it could still only claim associations. The Bradford Hill criteria advise that, unless associations are double, don’t bother looking for causation (Ref 12). None of the associations claimed in this paper are in that territory.
Issue 13 – relative vs absolute risk.
Another classic issue with all population studies is that they claim relative risk differences; absolute risk differences are usually tiny.
I calculated the absolute risk differences for the 2011 paper. This paper claimed 12%, 32% and 14% higher risk in developing T2D for 1 serving a day more of unprocessed red meat, processed red meat and all red meat respectively. In total, 13,759 incidents of T2D were recorded from 4,033,322 person-years of follow-up. That’s a 0.34% incident rate. The relative risk of 14%, for all red meat, would be an absolute risk difference of 0.36% vs 0.32% (Ref 13). Who cares?
For the 2023 paper, there were 22,761 cases of T2D. All cases were self-reported by participants. These occurred in 5,483,981 person-years of follow-up. That’s a 0.42% incident rate. Even though the 62% claim for relative risk for total red meat does not withstand scrutiny, this would be an absolute risk difference of 0.52% vs 0.32%. Who cares?
Issue 14 – plausible mechanism.
The discussion section of a population paper needs to offer a plausible explanation for the association claimed. This one tried to do this (many don’t even try). Suggestions given were:
– “Saturated fat, which is high in red meat, can reduce beta cell function and insulin sensitivity.” Red meat is not high in saturated fat. Meat is mostly water. Protein is usually the next major part. Of the remaining part that is fat, there is more unsaturated than saturated fat. The main fat in meat is invariably monounsaturated fat. Dairy products are the only food group with more saturated than unsaturated fat. If saturated fat is the mechanism, then you needed to study dairy products (Ref 14).
– “Heme iron increases oxidative stress and insulin resistance and impairs beta cell function.” i) poultry and fish provide heme iron, not just red meat, so where was the review of poultry and fish and T2D for rigour? and ii) a number of groups of people are at risk of iron deficiency and heme iron is the optimally absorbable form, so let’s worry about too much once we get enough (Ref 15). (This brings us to the wealth of nutrition generally in red meat, which would be lost if Harvard succeeded in their plant diet aim.)
– “Processed red meats often have a high content of nitrates and their byproducts, which promote insulin resistance.” That’s three claims for insulin sensitivity/insulin resistance being the mechanism of harm in a food that contains no glucose. How about examining the impact of burger buns, fries and fizzy drinks on insulin sensitivity/insulin resistance as a far greater issue?
This brings us full circle back to my first thought. What do hot dogs and hamburgers get eaten with? Buns, fries and fizzy drinks. The paper claimed to have adjusted for these (Table 2 footnote) but failed to report them in Table 1 so that we could see the extent of the difference.
There were so many issues with this paper. A number of the ones reported above should have been peer-review showstoppers. You can use any of these issues to rebut the continued non-sense that red meat is even associated with T2D. However, my favourite simple rebuttal to any research claiming that meat causes diabetes is this:
The ultimate test for red meat and T2D is to examine carnivores. Shawn Baker consumes 24 85g portions of meat daily. He will have zero concern about T2D and nor should he (Ref 16).
References
Ref 1: https://www.theguardian.com/science/2023/oct/19/eating-red-meat-twice-a-week-may-increase-type-2-diabetes-risk-study-finds
https://www.nytimes.com/2023/10/20/well/eat/red-meat-diabetes.html
Ref 2: Gu et al. Red meat intake and risk of type 2 diabetes in a prospective cohort study of United States females and males. AJCN. October 2023. https://ajcn.nutrition.org/article/S0002-9165(23)66119-2/fulltext
Ref 3: https://www.zoeharcombe.com/2011/08/red-meat-diabetes/
Ref 4: https://www.dailymail.co.uk/health/article-2024603/Diabetes-threat-slices-bacon-day-increased-50.html
Ref 5: Pan et al. Red meat consumption and risk of type 2 diabetes: 3 cohorts of US adults and an updated meta-analysis. AJCN. Aug 2011. https://pubmed.ncbi.nlm.nih.gov/21831992/
Ref 6: References from my PhD for the unreliability of FFQs:
– Beaton et al. Source of variance in 24-hour dietary recall data: implications for nutrition study design and interpretation. Carbohydrate sources, vitamins, and minerals. Am J Clin Nutr. 1983.
– Kipnis et al. Empirical evidence of correlated biases in dietary assessment instruments and its implications. Am J Epidemiol. 2001.
– Cook et al. The problem of accuracy in dietary surveys. Analysis of the over 65 UK National Diet and Nutrition Survey. J Epidemiol Community Health. 2000.
– Willett WC. Nutritional epidemiology issues in chronic disease at the turn of the century. Epidemiol Rev. 2000.
– Archer et al. The Inadmissibility of What We Eat in America and NHANES Dietary Data in Nutrition and Obesity Research and the Scientific Formulation of National Dietary Guidelines. Mayo Clin Proc. 2015.
Ref 7: https://nurseshealthstudy.org/sites/default/files/questionnaires/1980long.pdf from https://nurseshealthstudy.org/participants/questionnaires
Ref 8: Yuan et al. Validity of a dietary questionnaire assessed by comparison with multiple weighed dietary records or 24-hour recalls, Am. J. Epidemiol. 2017.
Al-Shaar et al. Reproducibility and validity of a semiquantitative food frequency questionnaire in men assessed by multiple methods, Am. J. Epidemiol. 2021.
Ref 9: Table 2 in the main paper reported intake in servings/day and calibrated intake in servings/day. I’ve extracted the relevant numbers below:
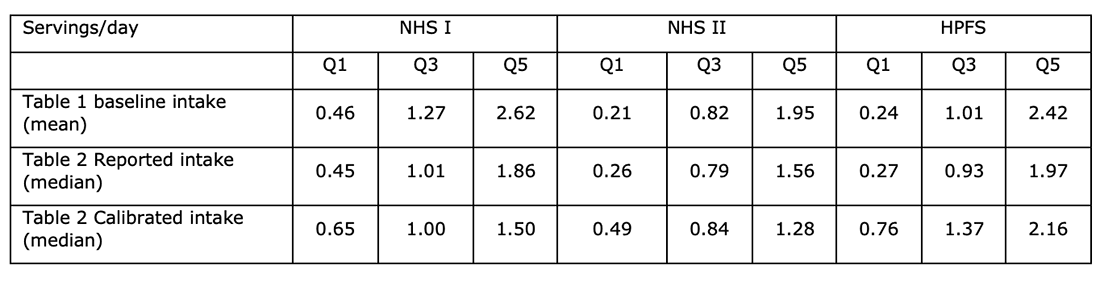
In all cases, calibration narrows the range from Q1 to Q5; and quite substantially. This would attribute smaller differences in meat intake to the same differences in diagnoses. This would make one serving ‘riskier.’ The calibration implies that women underestimate intake in the lowest group, get it about right in the middle group and overestimate in the highest group. Men underestimate, but less so from bottom to top. This could be a review in itself.
Ref 10: I checked the raw data from Table 2 and calculated raw case rates from cases and person years for each study and each quintile. This confirmed that, using unadjusted data and using Q1 as the reference 1.00, the total red meat case rate was 1.77; the processed red meat case rate was 1.86 and the unprocessed red meat case rate was 1.60. The total red meat number was between the other two, as would be expected.
Ref 11: https://www.zoeharcombe.com/2015/05/food-groups/
Ref 12: https://www.dietandhealthtoday.com/2016/09/the-bradford-hill-criteria/
Ref 13: I have built a simple calculator where I enter cases and person years and claimed relative risk difference. The calculator can then be used to find the numbers that meet the two criteria of i) averaging the overall case rate and ii) having one number higher than the other to match the relative risk difference.
Ref 14: https://www.dietandhealthtoday.com/2022/04/meat-saturated-fat/
Ref 15: https://ods.od.nih.gov/factsheets/Iron-HealthProfessional/
https://www.dietandhealthtoday.com/2018/10/heme-iron/
https://www.dietandhealthtoday.com/2022/10/does-meat-cause-cvd-t2d/
https://www.dietandhealthtoday.com/2021/04/meat-disease-again/
Ref 16: https://ultimatepaleoguide.com/people/shawn-baker/